 |
| Resistance-Support-Levels |
What is Support & Resistance-How we can differential between them?
Through different candlestick patterns, we learned how we can apply stop-loss and buying and selling points but we yet not discussed the targets of the stock. Through Support & Resistance, we can find out the target price of stock while buying or selling them. We will learn it with examples.Support
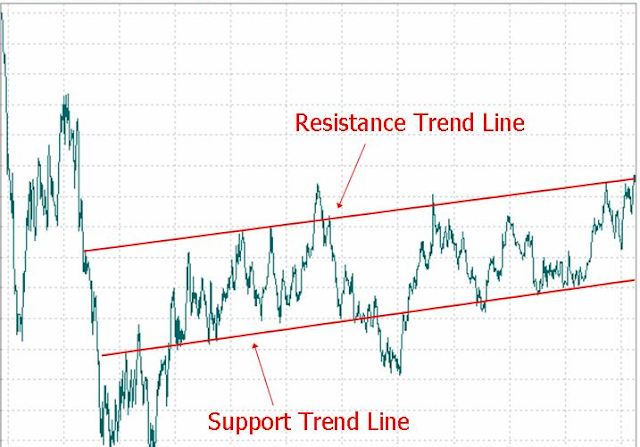
Support in the technical analysis means the Support trend line which stops the price of the stock to fall further or which gives support to the stock at that level. The important point here to note that support levels of the stock are always below the current market price of the stock. There are maximum chances that when the stock prices touch the support trend line of the chart then it will consolidate and rest, then again start moving up, support of the stock plays a very important role in technical analysis as it will be also a buying opportunity for traders as well as investors.
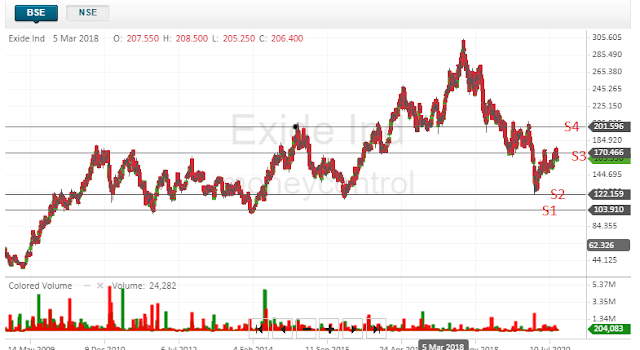
Below is the example of Exide batteries from which we will try to undertand the Support concept well:
Here I have drawn 4 Support trend lines S1, S2, S3, S4. Now you can see that the support level for every price is different-
Once the stock price is above 201 the support level was on 201, if the stock price comes down from 201 then support trend line was on 170 and once it will break 170 then support will come to 122 and after breaking this support also, the last supports comes on to 103.
Things to keep in mind while constructing the support trend lines
This needs to be practice after drawing the support line of the stock, you have to check that the stock price is respecting that line or not, if the price is respecting the line as well as it provides sharp reversal from that line then it becomes the support for that stock.
Resistance
Resistance as the name suggests that the price or the levels which hold the stock to move further. The Resistance level is always above the current market price of the stock. There are maximum chances that stock touches the line and respect the same and then takes sharp reversal from there which would be bearish. we will take the same above chart to understand the concept of the resistance trend line.
S4=R1, S3=R2, S2=R3, S1=R4
These same support lines will behave as the resistance trend lines if the price of the stock will come down to the current market price. If the current market price of the stock will come down to 201 then the R1 or S4 will become the resistance for the stock and you can see that the price touches this line and hesitate the move further and take downside journey from there many times, as it becomes the resistance for the price under 201.
The same you can see in R2 or S3 that when the stock price comes down from 170 then 170 becomes the resistance for the stock and it is hesitating to go up from here, It is not the thing that stock will not move up from here but it will take some time to break these resistance level if stock breaks them as their support levels.
Any one of us can make as many trend lines in the chart to check its further possibility of moving up or down and that is how we can get the target price of the stock. For the stock above its support line at the time of shorting, you will take the target of the stock as its support line. While if you are going long on the stock, then the target of the stock would be its nearby resistance trend line.
https://bijimoney.blogspot.com/2020/07/Candlestick-Technical-Analysis.html


Very nice.
ReplyDelete