Moving Averages-Important Investing and Trading Tool
We all have studied Moving Average in our lower standards either in Mathematics or in statistics but at that time we didn't work on its implementation which we are going to study today.
We know that average is just an approx calculation we do to reach on a specific conclusion, it cannot give us exact information about anything.
In the stock market, we cannot take everyday data at the same value because it is information sensitive data.
If we talk about only Moving Averages, then it would be a simple moving average where we have given equal importance to each and everyday data.
Date Closing price
1/01/2020 99
2/01/2020 100
3/01/2020 92
4/01/2020 95
5/01/2020 100
6/01/2020 102
We have 6 days data (closing price of the stock of all 6 days) and when we compute the moving average of this, then it would be after adding all the prices we divide them simply by 6, and then whatever the figure comes would be the moving average.
We keep on going to discard the oldest data point and keeps on including the newest data point like on 7/01/2020 we would discard the 1/01/2020 data and going to include the 7/01/2020 and so on.
We have taken the data points of closing prices of the stock as it would be the price for the day on which it settles down while moving averages can be computed for high, low, open prices as well.
A moving average can be computed for any time frame required- Minutes, hours, days, years.
These days it is very simple to understand all this just because you don't require mathematical calculations as well as excel formulas knowledge, you just have to put the technical chart on any website of chart study and then you can draw the line as per your requirement.
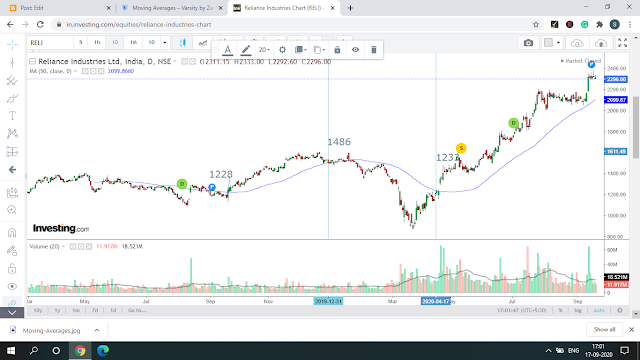
Below we have taken the technical chart of Reliance Industries and applied the 50-day moving average on the chart:
I have taken this chart from Investing.com
You can see that after applying the moving average there is one line formed (blue line) which is showing the stock price is sometimes below the moving average line and some times it is above the moving average line so what does it actually mean and what can be interpreted from the same.
We will surely understand this but before that, we should know the other moving average and what is the requirement of the same.
Exponential Moving Averages
As we already saw that in Simple moving averages we give each data points equal importance but sometimes due to information-sensitive data we cannot give equal importance to all data available, because the market discounts everything so, in that case, the price on the last trading day in discounted every information till then and accordingly the data on a previous trading date would be less important than the data of last trading date, in that case, we use Exponential Moving average.
In exponential moving averages, we give more weightage to the latest data and least important to the oldest data.
I am not going to calculate and problem here in spite we will directly move to the application of both the moving averages.
 |
| Exponential Moving Average Reliance |
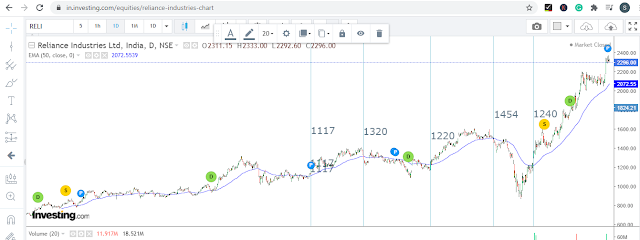
1. Buy or go long when the price is above the 50 days Moving Average or Exponential moving average and maintain your position till it will not break that level.
2. Exit your long position as soon as the stock price goes down from 50 days Moving Average or Exponential moving average.
Now, confuse what to follow MA(Moving Average) or EMA(Exponential Moving Average)?
I have presented both charts in front of you so that you can see the difference and decide on your own.
After drawing the Moving averages line in the reliance chart we got below buying and selling indicators:
Buy-1228 sell -1486
Buy-1233 and continue till today the position
Exponential Moving Averages
Buy-1117 sell -1320
Buy-1220 sell -1454
Buy-1240 and continue till today the position
So you can see that there is nothing much difference in the results but it can very chart to chart so your individual practice and experience will be important here.
Some trades can be profitable and some cannot give you much profit but it is the tool that will surely save you from loss and good for risk management which is a very important aspect in technical analysis while going long or short.
If anybody wants to know the drawing lesson for MA then let me know in the comments.
Moving Averages Crossovers/Exponential Moving Averages Crossovers
If you see a simple Moving Average and Exponential moving average then it will give you too many buying and selling signals which could not possible in day to day to track each and every day for all the stocks we hold or want to hold so we can work on the Moving Average Crossovers which gives us few buying and selling signals but more accurate.
Here we can compute the crossover of the two-time horizon, here are some rules to follow this crossover system with accuracy:
1. Buy when the short term moving averages turn greater than the long term moving averages, stay in the trade as long as the condition satisfies.
2. Exit the long position when the short term moving average turn lesser than the longer-term moving averages.
There are some popular combinations which analyst follow to check the buy or sell signals in the stock:
9 day EMA with 26 days EMA
This is for short term trades or for few sessions
25 day EMA with 50 days EMA
This is for a few weeks
50 day EMA with 100 days EMA
This is for a few months
100 day EMA with 200 days EMA
This is for long term investments


Averaging is very critical tool....
ReplyDelete