 |
Technical Charts Analysis-Know Chartmantras-Candlestick PatternsTechnical Charts Analysis-Know Chartmantras-Candlestick PatternsTechnical charts are the boon for traders as well as investors which helps a lot in predicting the markets and stock prices, Understanding of Technical charts is a must for every traders and investor as we discussed in Candlesticks-Heart of Technical Analysis that in the technical analysis we presume that history repeats itself and based on that we take the trades or make our action plan while on the other side of the coin we also keep in mind that these all are based on assumptions and everything can be changed at any point of time, so always be ready with a backup plan(exit strategy from the trade) if your trade is not going in your favor. We should always keep in mind that candlestick patterns depend upon, how the broader markets are doing. If broader markets are not doing well and your candlestick chart is showing a reverse direction then you need to analysis for the reason, there may be some good information floating in the market about that company. The knowledge of candlestick patterns is not only sufficient for you to work with, but you should also always alert with your analytical skills that why this is happening, anything good is not the assurance of stock's good performance and vice versa. There is always a backend of everything, maybe the information or the good news you aware of is already factored into the price, and the stock starts falling or starts consolidating after confirmation of that good news. Before taking the upside or downside trades, get well-versed with everything, and double assure yourself that you are right. Experience is much more important here along with knowledge as experience taught you the things which knowledge alone, cannot do, these both are required simultaneously, to get successful. Here are some single candlesticks pattern we should start with and sometimes only single candlestick patterns help you to make the best decision while trading or investing
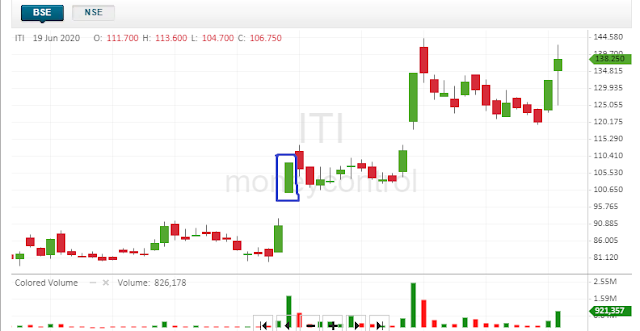
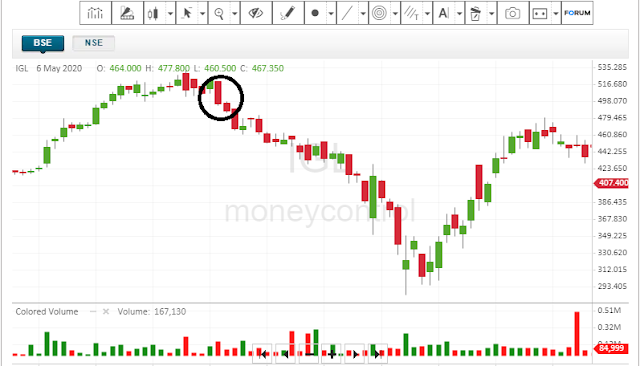
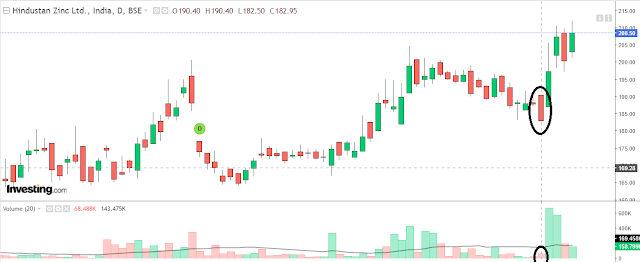
Marubozu CandleMarubuzo candle is the first candle type to understand. Marubuzo candle is not having any upper and lower shadow in the candle, however, some exceptions are there and we will understand this. Marubuzo candle is of 2 types - Bullish Marubozu and Bearish Marubozu. Marubuzo candle is the only candle that does not get impacted by the prior trend of the chart. Let's understand this candle in detail: Bullish Marubuzo is the candlestick pattern which shows the strength in the stock as the closed price of the stock is greater than the open price or you may say, Open= Low, Close=HighThis candlestick pattern represents, there is a lot of interest and charm looking by the buyers and buyers are bullish over this stock, It does not matter what is the prior trend but now the stock is bullish. Positive sentiments in the stock suggest being bullish while trading or investing and it will be there for a few sessions, we will try to understand the Bullish Marubuzo with an example: Here you can see the recent chart of ITI stock and Bullish Marubozu (marked with blue ink) changed the sentiments in the stock and starts moving towards upward direction: You can notice that there is no upper and lower shadow in the candle while there might be little variation between High and closed price and that would be acceptable as technical analysis always follow the rule "be flexible, Quantify and verify". The bullish Marubozu tells us that stock is going to be bullish in the near term but to confirm the validity depending upon the risk appetite of the trader or investor. There are two types of traders and investors- Risk-taker and Risk Averse RiskTaker is the person who wishes to grasp the opportunity as soon as possible so he will invest on the first day when Bullish Marubozu forms. On the other hand, Risk-averse person waits for the next day to check if that day is also bullish or bearish if next day also the open price is also the equals or higher the previous day close and continue the trend then Risk-averse will buy the stock but the problem in it that some times the stock buying gets very expensive and the trader and stock buyer may not get full benefit or cannot enjoy many profits. But on the other side, he can prevent himself from short term and longterm losses. Volume Bars SignificanceVolume Bars play a very important role while checking for the single candlesticks volume gives you a brief about what is happening behind the gate. In Bullish Marubozu if volume bar is also increasing then it means that buying is increased with good volume, it implies you buy the stock with confidence while if volumes are less with Bullish Marubozu then it could be less reliable. What if your trade goes wrong?As I already said in previous blogs that technical analysis always comes with uncertainty and risk, the game is not only to take positive trades but also to do the best risk management. If you have taken the trade as per Bullish Marubozu candlestick pattern but the trade is not going in your favor so to come up from the trade at the right time is also very important. In this pattern, you have to put the stop loss at the lower side of Marabozu candlestick. This rule is the same for both risk-taker as well as risk-averse trader, the stop loss would be the open price of that candle, because if the stock price breaks the open=lower, then it means it is going to be a bearish reversal. Bearish MarubozuBearish Marubozu indicates weakness in the stock, In this candlestick pattern High=Open & Low=Close. It indicates that all are bearish to the stock and only sellers are interested in it or sellers are very much as compared to buyers. The above chart is of IGL company and is showing Bearish Marubozu pattern, a little variation between closed and low price but that would be acceptable because it is very very less. In this type of chart risk-taker as well as risk-averse both would be beneficiary as on the first day of bearish Marubozu the sentiments are very weak while on 2nd day also the sentiments remain weak and the Close of Ist day= Open of 2nd day which implies bearish trend continues on the stock. While taking the short trade the stop loss would be the high of Marubozu candlestick, If by any chance your trade would go wrong then you should exit the trade when it touches the open of Marubozu candle day 1. Volume Bars SignificanceVolume Bars play a very important role while checking for the single candlesticks volume gives you a brief about what is happening behind the gate. In Bearish Marubozu if the volume bar is also increasing then it means that deep selling is coming ahead, it implies you to short the stock with confidence while if volumes are less with Bearish Marubozu then it could be less reliable. You can see the below example of Bearish Marubuzo candle made in Hindustan Zinc while the volume is very less comparatively the Marubuzo candle length, so this candle would be not applicable to take any short trades. Know Chart mantras
We will be discussing other candlestick patterns in the next blog as I don't want to make it very long because it might be the loss of interest for readers. I want you to learn and practice this candlestick with so many live charts. Charts you can study from https://www.moneycontrol.com/ |
Do you know your investment! Do you know your investment ! Investing is not only about money, but it is also about your emotions and hard work. If your investment is not fruitful and rewarding then you would not be motivated to do more hard work. A good and successful investment is like another earning member in your family who will take up your money, make your money work, and give you long-term returns. Investment is like buying today and consuming tomorrow, with an increase in quality and quantity. In other words, protecting our future and creating wealth. The purpose and meaning of investing can be different from person to person and profession to profession. Like the person earning 50k in a month, would be having a different investment objective, then the person earning 25k. Even their responsibilities would also play a vital role in investing, depending on their conditions, maybe the person earning 25 k is not having any major responsibilities while the person earns 50k ...


Beautiful blog
ReplyDelete👍👍👍👍👍
ReplyDeleteNice.. keep it up👌
ReplyDeleteShould I follow money control (https://www.moneycontrol.com) for trading ?
ReplyDeleteyes off course!
Delete