 |
Spinning Top Tool-Understanding with GraphsSpinning Top Tool-Understanding with GraphsAfter Marubozu candlestick we studied in Technical Charts Analysis-Know Chartmantras-Candlestick Patterns, the next very important candlestick is Spinning Top. Spinning Top is the as same as we see the above spinning toy picture but like Marubuzo this tool doesn't provide you a specific indicator of exit and entry points, although it is important to understand for the traders to understand their position. Take a look at how spinning top candle looks in technical charts and how it works: Important points in Spinning Top Identification:
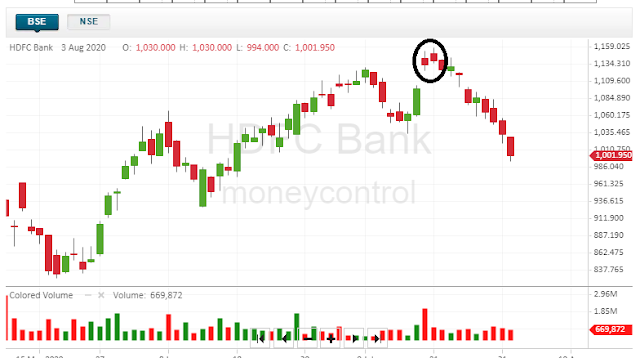
In both blue color spinning top and red color spinning top, upper shadow and lower shadow is equal, while the real body is small( not too small or not too large). Let us understand some important points related to Spinning Top: Real Body: The short real body indicates that the open price and close price of the stock are very close to each other, suppose open at 100 and close at 103 and the same is with bearish Spinning Tool, the open price is 103 and close price is 100. In both the conditions, the difference is only of 3 Rs so the color of the spinning top not very much matters, what matters is the closeness of the price. Upper Shadow: The upper shadow connects the real body to the highest price touches in that duration. When Blue color real body made and you see an only real body with upper shadow then it means that the market is in the grip of bulls and bulls tries to cover the bears but not get success because it opened at a high point and then bears get stronger and bulls leave their command. Lower Shadow: The lower shadow connects the real body to the lowest price touches in that duration. If it is a blue color real body made and you see the real body with lower shadow then it means that bear tries to cover the market with making lower and lower but they did not get successful and their attempt to drag the prices to the lowest is successful and bulls hold their grip tight over the bears. So, now you may get confused that what if bull not get successful and also bears not get successful then what happened and how this candle would be helpful. Spinning Top does not make any final decision, This candlestick shows the indecision while entry and exit from the markets. It is important to check the position where a spinning top has been made to reach a specific conclusion. This candlestick is helpful with other candle patterns, we will check how it is working and can take benefit from this candlestick pattern. What Happened if Spinning Top becomes at the Downward trend of the stock:If the spinning top becomes at the Downtrend of the stock then it can imply that now bear grip is over and bulls are taking part and showing interest into the stock so it can consolidate here as well as it can start an uptrend soon. Please note that the above chart of TCS has been taken from the MoneyControl website. You can see the above example of perfect Spinning Top made at the downtrend of TCS and from here an upper trend starts of the stock and continues. There is very important that you should never be very confident here while taking the position if you want to play with this candlestick then only go with 50% quantities. Suppose if you want to buy 1000 quantity of particular stock then only go with 500 and for the rest 500 quantity, you should wait till the confirmation of the trend so that you could save yourself from going wrong and also you can come up with the opportunity to trade with Spinning Top. What Happened if Spinning Top becomes at the Upper trend of the stock:If the spinning top becomes at the Uppertrend of the stock, then it can imply that now bull grip is over and bears are taking part and showing interest into the stock so it can consolidate here as well as it can start a downtrend soon. The above chart is of HDFC BANK live chart which is presenting a Spinning top at the upper trend and from here a downward rally in the stock has been started. There is very important that you should never be very confident here while taking the position if you want to play with this candlestick then only go with 50% quantities. Suppose if you want to sell 1000 quantity of particular stock then only go with 500 and for the rest 500 quantity, you should wait till the confirmation of the trend so that you could save yourself from going wrong and also you can come up with the opportunity to trade with Spinning Top in the downtrend. Please Note: You should do a lot of charts practice and once you get the confirmation that you are 100% ok with the tool and your success rate and assumption rate is successful most of the time, then only take the trades on this pattern otherwise do not take any trade on this candlestick and wait for the next candlestick pattern to make any important decision. |
Do you know your investment! Do you know your investment ! Investing is not only about money, but it is also about your emotions and hard work. If your investment is not fruitful and rewarding then you would not be motivated to do more hard work. A good and successful investment is like another earning member in your family who will take up your money, make your money work, and give you long-term returns. Investment is like buying today and consuming tomorrow, with an increase in quality and quantity. In other words, protecting our future and creating wealth. The purpose and meaning of investing can be different from person to person and profession to profession. Like the person earning 50k in a month, would be having a different investment objective, then the person earning 25k. Even their responsibilities would also play a vital role in investing, depending on their conditions, maybe the person earning 25 k is not having any major responsibilities while the person earns 50k ...


That's Amazing!
ReplyDeleteNice blog .
ReplyDelete👍
ReplyDeleteCool!
ReplyDelete